An obsession with words

The Blognosticator in Munich

Though it has nothing in common with my usual posts, I want to say a few words about my obsession with the New York Times’ Spelling Bee puzzle.

This is the format of the Spelling Bee puzzle in the New York Times.

It’s fun! It’s cause for insanity. It’s enough to make you either a genius or a maniac, or both.

I play it every day, and for the past year I have been able to get to Genius level every day. Sometimes that takes me ten minutes, other times it takes me, on and off, all day and late into the night to reach that goal.

And, three times in the last year I have made it to Queen Bee status, where I have gotten all of the possible words in that day’s puzzle. This morning I made Queen Bee status with the word “inbox.” I was thrilled (and I am being quite modest about it).

In the approximately half year that I trained to be a genius every day, I occasionally cheated by using a web site called WordHelp.com. There, you can put in the seven letters (I put them in twice each) and it will tell you all the words possible with those letters. Some of its words are not allowed by the New York Times for various reasons, but it will often get you out of a jam.

One year ago I got good enough at the puzzle that I stopped cheating, and pledged never to use WordHelp again. I have been true to that pledge, and have not been back.

Now I rely entirely on my wit, my memory, and luck to get to Genius every day. I also use the built-in dictionary on my iPad to check words as I enter them (this isn’t cheating because it is only verifying that a word is spelled correctly, and it is available inside the Spelling Bee puzzle itself). If I touch and hold, the word will be highlighted and an option to “look up” arrives on-screen. I will occasionally look up words in the solution list because I have never seen them before and I want to know what they mean. I used it for fettuccini recently.

A few months ago, a man in New York made a web site for people like me who are obsessed with the Spelling Bee puzzle. It’s called NYTBee.com. I like it, and I look occasionally to see how many words it will take to get to Queen Bee status. I also check to see words that are in Webster’s, but not usable in the puzzle that day. There are a lot of these words. Yesterday I wasn’t able to use “nonunion” even though it is a perfectly valid word in the dictionary.

In NYTBee.com you can also cheat and see the words for that day’s puzzle. I never do this. I would rather wait until the next day to see the words I missed. My puzzle day begins at exactly 9:00 a.m. European Central Time when the Times posts the new day’s puzzle. I am often waiting at that minute to check my words against the official list, and to start work on the next day’s challenge.

I have developed the skill of Genius-making on the Spelling Bee, and I thought I would share my techniques with those of you who are obsessed with Spelling Bee, or might become obsessed.

Every day there is at least one pangram, defined as a word that uses all the available letters. Sometimes there is more than one pangram; those are great days.

I treat the pangram as my first stab at getting a good score. I stare at the letters and play anagram games in my head, trying to make words, or prefixes and suffixes. Sometimes the pangram will jump into my head, while other times it takes much longer. I usually stick with it until I get it, and only then move on to the easy words.

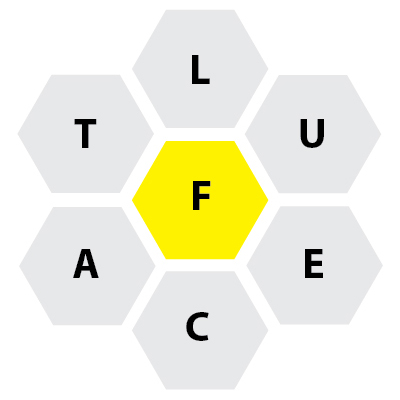
The rules are simple: you must use the center letter in every word; you may use any letter
one or more times; each word you spell must be in the official list of words for that day.
There is at least one “pangram” in each day’s puzzle, that being a word that uses all seven letters.

If you get a pangram, you get lots of points for the word.

Four-letter words get 1 point each; more letters earn 1 point more per letter; pangrams get 7 extra points in addition to their word score.

Proper nouns are not allowed, nor are obscene words. This is a carefully curated puzzle.

I bang-out the obvious words first, getting as many points on the list as possible. Then I try adding prefixes like “un” or “in” or “en” or “re” and I read down my list of words trying to add the prefix if I can. “Noble” might become “ennoble” or “done” could be turned into “undone.” When you have exhausted the prefixes, look for suffixes, adding “ed” or “ing” to every word you have made so far. In the process you will find words that you weren’t looking for. Some days you can nearly double your score by adding “ing” to most of the words on your list. Those days I call gerundific days.

When you have reached Amazing level, and it seems that you cannot find any more words, look for opportunities to use:

  • Pasta: rotelli, tortoni, fettuccini* etc.
  • Other food words: blini, falafel, tortilla, tapa, naan, bialy, focaccia, onion**
  • Musical terms: trio, quartet, nonet, octet, tutti, largo, rondo, duet
  • Geometry terms: nonagon, octagon, decagon, dodecagon, septagon, hexagon, et ceteragon
  • Body parts and medical terms: ulna, alveoli, atria, and related plurals
  • Common chemical and biological terms: anionic, ionic, amoeba, oleic, niacin
  • Japanese gates: torii (who knows why, but it shows up often)
  • Japanese cushions: tatami

*Note that “fettuccini” was only allowed with this spelling, and not the other five options possible in Italian and other languages.

**If you start participating in the Spelling Bee, you will use “onion” several times a week. Naan is another regular in the Spelling Bee.

Most of the time these categories, and the words that you will memorize over time, will help you succeed every day. You’ll also start to add words that are used in the puzzle regularly. Eventually you’ll get to the Genius level, and say, “What’s next?”

This is the screen that pops up
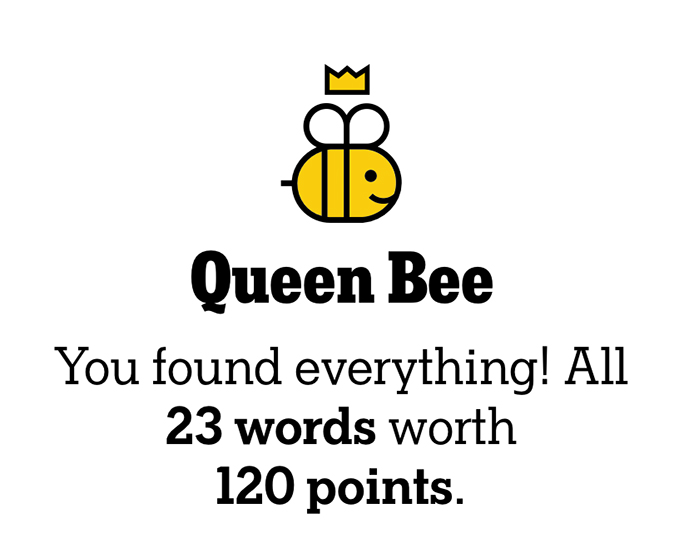
when you earn Queen Bee status.
It would be nicer if the word “All” were on the same line as the words in the next line, and the word “worth”
found its way down to the next line also
(the typographer’s comments).

What’s next is Queen Bee, where you get every possible word in that day’s puzzle. To reach this level you should try on days when Genius is achieved with fewer than 30 words. The difference between Genius and Queen Bee is daunting, and with more words, there are more needed to get to Queen Bee.

Yesterday I got all 27 words to reach Queen Bee. To reach Genius only required (for me) 24 words, so I had to find only three more, and that was comparably easy. On other days, when there are 35 or 45 words to reach Genius, the distance to Queen Bee is immense – sometimes 10 or more words. And, where on Earth am I going to find ten more words?

The satisfaction of reaching Queen Bee status is incredible. I walk down the street with a big grin on my face (missed entirely by the neighbors who pass me).

I hope that these tips will help you to reach Queen Bee level soon so that we can celebrate together, or at least you can smile as you pass me on the sidewalk.

Note: Playing the Spelling Bee requires access to the New York Times online. You can get a regular subscription, or there is a special subscription that gives you access only to the puzzles. This includes the famous Times crossword puzzles, Spelling Bee, and several others. That subscription is just a few dollars per month.

Posted in Language and grammar | Tagged , , , , , , , | Leave a comment

A refined approach
to repositioned panoramas of Munich street art

The Blognosticator in Munich

Four years ago I was teaching in Munich, and during that time I photographed a number of pieces of street art on Tumblingerstraße in the city. You can read that story and its associated comments here.

The photos were taken in the urban landscape, on a street with cars parked along the curb, making it impossible to step back far enough to take photos of the works in one frame. Also, single photos are not high enough in resolution for my projects. I need hundreds of megabytes in order to print on wide-format ink-jet printers or large pages on offset presses.

This is one of several test images I created using the technique described in this article.
I like the way the real motorcycle and scooter blend into the mural as if painted there.

In response to this need for high resolution, I used a technique I call repositioned panoramas where the subject is photographed as a series of images taken horizontally at fixed intervals, then stitched together in Adobe Photoshop using its Photomerge function.

I have used this technique to scan strips of historic photographic film, creating multi-gigabyte images. The technique works really well.

In the field, it’s slightly more challenging to shoot “panoramic” images if you move the tripod between shots. In fact, if you are shooting anything with visible perspective, it makes images that are impossible to stitch.

My street art photos pose very little perspective trouble because they are painted on walls, and those walls have almost no relief, therefore not much chance of perspective shifts. In 2017 I used a technique where I took a shot, then took three careful steps to the right, then took another shot, and continued until I had a stepped record of the scene.

It worked well, and the images I made were excellent. They exhibited some small flaws, but I attribute these to my handling of the camera with no tripod.

Another example of the street art on Tumblingerstraße in Munich.
The works are fluid, and are often replaced by new works put up by other artists.

I am back in Munich now, teaching at Hochschule München, and on my second weekend here I ventured back to Tumblingerstraße to see how it has changed. All of the artwork is new – it is constantly refreshed with new art – and the location has expanded considerably. Now there is an entire village on Tumblingerstraße dedicated to street art and related art. There are buildings inside the wall with more art, there is a café, and it appears that people live and work in the village (I’m still learning about the village).

My students tell me that there is an occasional concert there, and on Sunday last week there was a flea market there, open to the public. People were lined up to buy fleas.

To make my repositioned panoramic images better I knew I had to be more accurate in taking the source photos, and for that I needed a team of photographic helpers.

As part of the course I am teaching, I have the students documenting Tumblingerstraße, interviewing the artists, and taking a large number of photos. These will become part of a book we are writing and producing as part of the class. One team worked on taking new repositioned panoramic images of the artwork.

Our new technique relies on using a tripod, using a higher-resolution camera, and taping a long piece of string to the sidewalk, marked with increments for the camera (we tied knots in the string every meter). We set up the camera, put it on manual focus and manual exposure, then locked the camera facing the artwork. We then hung a plum-bob from the center column of the tripod, and moved the tripod and its centering tool from one knot to the next for the photos.

This is one of over 100 knots we tied in the string to mark the increments for photography.

The string was taped to the ground at three meters’ distance from the wall, so the subject-to-camera distance was constant. This meant that we were photographing the artworks with much more precision than I had when I first did this. We took two photos in each position – just in case – and we moved a total of 130 meters along the wall to capture all of the images.

Two of my students positioning the string three meters from the wall.
This step was critical to getting the shots to be consistent.

The images on this wall are not level, nor is the wall. It goes downhill, and so do the images on it. We set the camera parallel to the base of the wall to photograph each image as straight to the wall, regardless of the slope of the wall. As a result, the slope is removed from the images.

By eliminating almost all opportunity for error, we made the exposures and then processed them through Adobe Bridge to convert them to DNG* as we downloaded them from the camera card. Then we selected a series representing one piece of work and opened them in Adobe Photoshop.

From there, we chose Automate from Photoshop’s File menu, then Photomerge. In Photomerge, we selected the open images, chose Reposition as the technique for the merge, and let Photoshop do its work. Running on a new MacBook Air with the M1 processor, each combined image too about one minute to process. The resulting images are about 250 MB each, and show no significant errors of stitching.

These will make excellent photos for inclusion in our book, which we plan to print with long, wide pages to accommodate the wide stitched panoramic images we made at Tumblingerstraße.

*You can read my essay about converting Raw files to DNG here.

Posted in Adventures, Art, Panoramic Photography, Photography, Photoshop techniques | Tagged , , , , , , | Leave a comment

AppleScript solves my grid mask challenge in Adobe Photoshop

I pride myself on being a competent user of Adobe Photoshop. I know how to make my photos look good by sliding sliders and pushing buttons and applying filters and adding Layer Effects and all sorts of visual things.

Occasionally I need to do something out of the ordinary, and in these situations I combine my skills in Photoshop with my skills in programming with AppleScript. I taught myself AppleScript back in the 1980s when I had insomnia. I simply couldn’t get to sleep at night. So, instead of counting sheep, I wrote programs with AppleScript.

This is the collage of images I wanted to make in Adobe Photoshop. I used an AppleScript to make a checkerboard mask for the photos, then used that mask (and an inverse of it) to mask each photo separately. This made it possible to create an image without a single pixel out of place.

For the uninitiated, AppleScript is a scripting language on the Macintosh computer. It is a full-bodied computer language that can send and receive instructions to and from various applications. You can, for example, query a FileMaker database, copy a line of information from that database, then move that copy to Adobe InDesign and paste the text into a document, while applying a specific type font, size, leading and color. It’s a very clever language.

The greatest advantage of AppleScript is its “natural language” quality. It has English-like commands (other languages are also supported). You can issue a command like:

tell application “Photoshop”
activate

…and the script will open Photoshop. Many applications have sophisticated AppleScript-ability. Some have none, so you cannot control them with AppleScript.

AppleScript wasn’t my first programming language. I learned COBOL in college, had learned a language called WPL on the Apple II, and had taught myself BASIC and some Pascal, all of which I found intriguing. I believe that once you learn any programming language you can use your skills to learn another. This is because programming languages have so much in common. It’s mostly form and syntax beyond the basic control functions. You just have to learn the localized grammar, and then figure out the details.

Yesterday I was working on a photo mural and I needed a set of absolutely precise masks to make a checkerboard collage of images. I started out with 24 selected images from a project I did in 2016 called the Bishop Peak Portrait Project. That project was a year-long photographic study of a mountain in San Luis Obispo. I took about 200 photos every day with a camera in a weatherproof box on the roof of the Kennedy Library on the Cal Poly campus.

The camera was trained on Bishop Peak, the most popular of the nine mountains that run from my city out to the ocean at Morro Bay, where Morro Rock is the second-to-last mountain in the chain. These glorious peaks were once part of the rim of a huge volcano that formed this part of California. We got the west half of the rim; the east half is located about 100 miles south of us in another part of the state.

My project was supported by a grant from Cal Poly’s College of Science and Mathematics. I started in March, 2016, and ended on the last day of February, 2017. Between those dates I took about 70,000 photos of my favorite mountain.

The camera was a Canon T5 with a standard lens zoomed to about 50mm. The camera was powered by two 12 volt motorcycle batteries and they were kept charged by a couple of small solar panels. The camera was controlled by a Raspberry Pi microcomputer on a circuit board of my own design. It had two small power supplies and a transistor circuit that triggered the camera when the Raspberry Pi signaled for an exposure. I had it set to take one photo every five minutes from 5:00 a.m. until about 10:00 p.m.

I had a 256 GB SD card in the camera which allowed me to leave the camera unattended for weeks at a time. I would occasionally climb the six floors to the roof of the building and retrieve the camera card, replacing it with another.

Then I would discard the nighttime shots – many of my photos were black rectangles – then rename the files in Adobe Bridge (I used a six-digit numbering scheme). Then I scored the photos in Adobe Bridge, giving them four stars if I liked them, and five stars if I loved them.

Eventually I had to pick only one photo to represent the best image taken each day for 365 days. It was surprisingly difficult because there were so many to choose from.

The end product is a mural on permanent display at Cal Poly of the 365 photos, each printed on a 5 x 5 inch square of aluminum, mounted on a 22-foot panel in calendar order. It turned out really well.

This year I was approached by a representative of a local law firm to provide some images for their new office. It was suggested that I could pick some of my Bishop Peak photos to make a photo collage for a wall in their foyer.

I looked through my photos and picked about 30 of my favorites. Then I opened them (they are all DNG raw images) in Camera Raw, made adjustments for contrast and vibrance, and converted them into Photoshop images. Each is about 12 x 9 inches in size at 300 ppi.

I wanted to make a grid of photos six across and four down for the collage. The total size of the final image is about six feet wide by three feet tall. The image will be printed and mounted on stiff Gator Foam board, then attached to the wall with a wooden cleat.

I made a layout in Photoshop with blue guidelines separating the master image into a grid, then I started bringing in the images and arranging them in an attractive layout.

After the second and third images I realized that it is very difficult to get the edges of these photos to align with pixel-precision and not have any gaps or corners that show errors of position or size. I needed a mask!

So, I drew one, and then I copied it and propagated it across my canvas. But it was slightly off, and the corners didn’t work perfectly, and at the end of the first row I had a handful of pixels that ran off the end. I needed more precision.

I decided to draw the masks using AppleScript. To do this I made a template in Illustrator and put the coordinates in pixels onto the template.

This is my annotated grid for the mask script. Each pair of numbers is the X,Y position for that corner
of each mask in pixels. The entire canvas is 21,516 X 9964 pixels in size.

Photoshop can be programmed with Visual Basic on Windows machines, with Javascript on Mac and Windows, and with AppleScript on Mac. I have considerable experience with the AppleScript version, and I approached it by opening a script I had written a few years ago when I was making the 365-photo mural for Cal Poly. That script uses pixel coordinates to make a block of black on which I put the date and time of each photo. I saved a new copy of that script, stripped it of its text components, and kept the rectangles part for my masking adventure.

The idea was to make solid black rectangles of exactly the correct size for one photo, followed by an equal amount of white space, followed by another black rectangle until it filled the canvas with a checkerboard of solids and white spaces. This would be the primary mask. I created a canvas in Photoshop and had it open, then I tested my script on a single rectangle. It worked, so I built a whole row and tested it again. That failed due to a simple math error, so I fixed that error and got a row of three black rectangles with equal white spaces between.

Here is an example:

This is a single line from the AppleScript that describes the coordinates of one of my rectangles.
It uses a Cartesian coordinate system of X,Y points, then in a subsequent line it
fills the rectangle with black.
In the line of code you’ll see that the bold words are commands, the green words are variables, and the integer values are shown in bold. Sets of brackets hold pairs of X,Y coordinates made up of variable names
and integers. In the script I first set the variables to 0, and then increment them for the various rectangles.

Then I incremented the vertical starting point and made the second row of rectangles. That worked also, so I made all four rows. After testing it, I saved the canvas and began inserting the 24 photos into the document.

I only need two master masks for this project, and one is the inverse of the other, so I only created one checkerboard.

After I dragged a new photo onto the canvas, which results in that image being on a new layer, I selected one or the other mask, then created a layer mask for the photo, isolating it from the adjacent images (one only has to avoid those whose corners touch). The next photo used the opposite mask, and gradually I built the collage with its 24 images, 12 using the positive mask, the other 12 using the negative.

Note: It’s important to unlink the image from its mask on each layer so that the mask stays put while you move the photo around inside it. This is done by clicking on the chain icon between the image and its mask in the Layers menu.

The photos are very consistent, with the mountain appearing almost exactly in the same location in each image (I use another script I wrote in 2016 to crop the images to the correct ratio, and to put the mountain top in the same position from image to image.

It took several hours to build the final collage, and it is pixel-perfect. There is not a single corner that is not correct; no hairlines show; no gaps exist. It is absolutely accurate.

The Scripting Guide published by Adobe gives (mostly) clear examples and instructions for controlling Photoshop. They also publish similar guides for Illustrator and InDesign. Automating tasks and producing visuals with absolute precision are the byproducts of the scripting supplements for these three applications. The syntax can be confusing at times, but I have always been able to find online examples that clear-up ambiguities when I get stuck in an AppleScript program, or an Adobe-specific implementation of AppleScript.

Regardless of your choice of programming languages – VisualBasic, Javascript or AppleScript – if you commit to learning how to automate with scripting, the benefits are many. It takes a bit of time to master it, but the results are worth the effort.

Posted in Art, Imposition and Pagination, Photography, Photoshop techniques, Software | Tagged , , , , , , , , , | Leave a comment

Illustrator graphs show me how my solar system is working

Greetings Blognosticator readers!

I (sort of) apologize for my long absence from this blog. I retired from my teaching position at Cal Poly in mid-June, and have been relaxing since then by not contributing essays to this forum. Instead, I have been working in my wood shop, doing home repairs, and doing a lot of reading. I have also been doing quite a bit of kayaking on Morro Bay, in San Luis Bay, and on Santa Margarita Lake, all of which are close to my home. I like retirement so far!

Seven years ago I installed eight solar panels on the roof of our home. I did a lot of the installation myself, and hired an electrical contractor to handle the connection to the utility box and working with the city inspector to get the work approved so that the electric utility would allow me to turn it on.

At the time I estimated that the return on investment would be pretty fast: four years.

I got a federal tax credit for about 30% of the cost of installation. I also got the do-it-yourself discount. I did all the planning, permit applications, site drawings (I went overboard on these, making realistic drawings in Adobe Illustrator), the roof preparation, installation of the rails, panels and inverters. My electrician put in the conduits, and drilled through the roof into the garage to deliver the power to my electric panel. He and I pulled the wires together, did all the finished wiring on the roof, and celebrated the completion of the project when we got the permit approved.

This is a sample of the illustrations I created to apply for my building permit.
The local officials were impressed by the detail.

In San Luis Obispo we get a lot of sunlight; it almost never rains, and it never snows. My pre-installation estimates showed that the panels would generate enough electricity to break-even in about four years. After we turned the system on, it generated more power than my estimates, and it paid-off in three years and three months.

But I still had an electric bill.

I had foreseen this, and I had the electrician put an extra stub conduit on the roof with a weather cap on it. I had also received my building permit for 12 panels (even though I installed only eight in the first round). 

So, adding four more panels – after three years – was really easy. I bought the panels, installed the rails and attached these to the roof. I ran a new conduit to the stub, pulled the wires, and connected everything together at the junction box. Then I turned the system on and was suddenly generating 50 percent more energy!

And my electric bill dropped to zero (though our utility requires a minimum $10 per month to be connected to the grid).

On the “net metering” agreement I have with the utility, I get one power bill each year, and that bill arrived last week. For 2020 I paid $10 each month, and, after all charges and debits, I owe the utility a whopping $18.06 for the year. My cost for electricity for the year was $138.06.

The investment of money and labor to install these solar panels was obviously a good one. For the first three years I checked the host web site every day, then, after pay-off, I stopped looking every day. After installing the additional four panels I was back to checking it every day, but I lost interest after a couple of years.

Last week I decided to check up on my system: Was it still working correctly? Am I still generating enough power to break-even? How did 2020 compare to previous years? Are the panels degrading in efficiency?

(And this is where this article takes a turn toward the graphic arts…)

I use Enphase inverters on my system, and they report through a hardware portal to the Enphase web site. This site allows me to monitor my system, to check for equipment failure, and to monitor my power generation. That site allows me to see my generation graphically, and it also allows me to download spreadsheet files for analysis offline.

I downloaded two years’ worth of data in CSV format. Then I opened those files in Microsoft Excel, deleted some text that was redundant, and saved the file in text-based tab-delimited format (this may not have been necessary). Oddly, I couldn’t get Excel to find-and-change the entries – it just refused to work – so I placed the tab-delimited text into an Adobe InDesign document and did the editing there (strange, I know, but it worked). Then I exported it back to a text-ony file.

The amount of data is not overwhelming – two years of two columns of data – but I knew that I would need to make a relatively large page for my graphs in Adobe Illustrator to show the information adequately.

Adobe has relegated the Graph tools to the Illustrator backwater, so I had to move them to the current tool bar (this is done at the bottom of the tool bar pull-out menu). Once there, I started with the line graph tool and made a 36-inch-wide graph rectangle with the tool. This opens a table into which you can upload data in several formats, among them tab-delimited text.

I imported one year as a line graph and plotted the daily watt-hour values on the vertical while plotting the days of the year on the horizontal. 2020 was a leap year so it has 366 data points; 2019 has only 365; this creates a single-day problem of alignment that I decided to ignore (it’s gestalt).

This is the line graph version of my solar data for two years. It’s too busy and not very attractive.
It reminds me of the financial graphs presented in the Wall Street Journal.
CLICK TO ENLARGE

Graphs can be tricky. It’s difficult to show clearly what is important, and do it in a way that is attractive. Illustrator’s graph tool is also a bit strange in its automatic formatting of text and indices. It chooses a default font (perhaps it’s the one you’ve been using most recently?) and scrunches mountains of data (the horizontal date information) into a pile of overlapping entries. I selected these text items with the Direct-select arrow and changed them from 36 point Myriad Pro to 4 point Myriad Pro Condensed. That made them legible at least.

The text indices for the Watt-hours were too small, so I changed them, and also edited them to Kilowatt-hours by removing three zeroes from each one (the vertical values are still valid). On a good day in summer we generate 22 KWh of power; on a cloudy day in January we generate about 5 KWh.

One pleasant thing about the Graph tool is that elements in the graph are easy to select en masse. The line graph is made up of 365 separate line elements, each ends with a small rectangle at its intersection with the next. To color, stroke and fill these individual items I use the Select menu to choose all items of the same stroke weight, or all items with the same stroke and fill. In the process I can customize the graph to make it more attractive.

As long as I don’t Expand Appearance on the graph, the data in it are interactive. If you change an element in the table, the graph will be updated automatically. Most of the time I like this feature, sometimes it gets in my way. Deleting, grouping, averaging, or joining elements will result in one of Illustrator’s obsequious dialog boxes telling me that I cannot do that.

Data-on-data
My final graph of the year 2020 looked pretty good, until I showed it to my greatest critic – my wife – who was confused by it. After taking her thoughts under consideration I decided to redraw the graph as a vertical bar chart. This gives the data body, showing that the solid areas represent electricity being generated. The line graph shows just a wiggly line that is not as informative visually.

This is my modified bar graph, showing electricity generated in 2020,
with 2019 generation data overlaid as a line graph.
CLICK TO ENLARGE

But having a graph of my power generation for one year didn’t answer my questions. How did my panels perform compared to another year?

I drew a second graph with 2019 data as a line graph. I selected the line elements only from that graph and pasted the data on top of the bar graph for 2020 (this is where the 366-to-365 data points became an issue). With this line graph superimposed atop the bar graph I can see that my electricity generation from year to year is approximately the same.

Taking the hours of daylight into account (a simple curve with its peak in July), my system generates a more or less constant amount of power relative to exposure to the sun. Thus my charts are annual descriptions of sunlight falling on my roof.

Curiously I made more power in 2020 than I did in 2019. This answered a couple of my questions: are the panels still performing efficiently? and do they perform about the same as they did the previous year? I was pleased by both answers.

Eventually I added a gradient to the vertical bars with red at the top (for high output) and yellow at the bottom for low output. Superimposing the 2019 data on top of the 2020 bar graph is noisy, but it does illustrate the output for the year in a way that I can see it clearly.

In 2020 we had our house fumigated, and thus the panels were covered for 1.5 days. That is the only time that I have not generated power with the system.

I like Illustrator’s Graph tools; they put the data on the page in a way that I can customize it to make an attractive (and effective?) graphic illustration of numerical data. Adobe has not updated that tool in many years. Perhaps it is in need of a facelift to make the graphs more attractive or easier to manipulate.

Posted in New technology, Software | Tagged , , , , | Leave a comment

Saved by the wire (and the fiber-optic cable)

You would never think that a wire could slow Internet speed. Well, perhaps you would think of that, but I hadn’t thunk about it much. I was once warned by my friend Eric that the wrong kind of wire could bring an Ethernet network to its knees. I knew he was right, but I didn’t act on it because it didn’t affect me. Until last week.

Ethernet, the electrical and electronic architecture that runs the Internet, runs on copper wire (mostly). Inside our offices and homes are kilometers of cables that deliver digital signals to our computers from nodes of the Internet far away.

In my home I have numerous computers, two printers, two Apple TV units, one Roku, and a device that reports from my roof-top solar panels. These are the wired connections, all of which use Ethernet. Unfortunately, our home was not wired with the Internet in mind. Though it’s a modern house, it has an older telephone wiring system. That has not been helpful in my networking efforts.

I have solved two problems with network wiring by using devices called Tendas. These take an Ethernet signal and put it onto the household electrical wiring. They cleverly deliver Ethernet where it is impossible to get wires; you plug a Tenda device into any electrical outlet, and then plug an Ethernet cable into that device. Elsewhere in the home you put another Tenda and pick up the signal there. With these devices I have Ethernet at my electrical utility box, and thus I can monitor my solar panels.

Apple’s USB-to-Ethernet adapter. It’s rated up to 100 Mbs. (Image from Amazon.com)

A couple of weeks back my neighbor told us that she and her husband were on the new fiber-optic Internet service provided in our city by AT&T. I had seen men on fancy trucks pulling the fiber along the overhead lines a couple of summers ago, but I didn’t know it was ready for consumers. I was excited! Our Internet has been provided for the past 15 years by a local Internet Service Provider. It was bonded DSL, and the fastest speed we ever got was 32 Mbs down and 6.7 Mbs up, which is pretty poky. The alternative was the local cable TV supplier, whose offering is much faster, but famously unreliable.

Mbs is Megabits-per-second, the measurement unit of network speed. Divide that by 10* and you have Megabytes-per-second – approximately – and that tells you how fast your Internet connection is. On a 100 Mbs connection you can send and receive 10 megabytes per second. If you have a 25MB Photoshop file, it will take approximately 2.5 seconds to transmit the file over the Internet. That is acceptably fast in today’s world. AT&T’s fiber-optic is ten times faster than that, so the same 25MB file would take only 0.25 second to transmit. I was salivating!

I jumped. A call to AT&T got me started. Limits? Throttling? Extra fees for non-AT&T suppliers? No, no, and no. It seemed too good to be true.

I signed up, and three days later a team of skillful workers showed up at my house. They pulled the fiber through an underground conduit into the phone box on my house, then they drilled through the wall into a discreet spot behind my television and installed the gadget that converts the optical signal into an electrical signal. Then then routed that back out to the phone box, and somehow got the signal upstairs to my office, where they installed a modem and WiFi router.

In three days I went from 32 Mbs to 1000 Mbs signal speed. I was thrilled. The AT&T service is also half the price of my former service. I now get 30X speed at .5X price. You can’t beat that.

Apple’s Thunderbolt-to-Ethernet adapter. This one is rated to speeds up to 1000 Mbs. (Image: Amazon.com)

Everything was moving faster except my primary computer, a Mac Pro (cylinder). With that machine I was getting only 67 Mbs after the fiber-optic install. My MacBook Air was getting a similar speed, but its Ethernet comes through a USB adapter (there is no Ethernet port on a MacBook Air). Even the new WiFi was faster than either of these, coming in at about 350 Mbs.

I started troubleshooting. Was it my 16-port Ethernet switch? Was it my Mac Pro? Did I have a defective connector? I started dragging wires around the office, draping them over tables and chairs, connecting this to that, and then that to this, and I discovered that my wife’s Mac Pro was running at 900 Mbs-plus while mine was clocking-in at a paltry 67 Mbs.

It was the wire.

I looked it up. There are three common wires used for Ethernet wiring: CAT-5, CAT-5E, and CAT-6. They have eight wires inside, each twisted in pairs, then co-twisted at very specific intervals to prevent cross-talk and electromagnetic induction. Though this is pretty esoteric, I realized that I must be a victim of induction-related trouble.

I installed a new Ethernet cable between the Switch and my computer, and it suddenly soared to 938 Mbs! Wow!

My cable had also been way too long, so I had coiled the left-over part into a nice 8-inch coil on the floor behind my computer. It turns out that this is a very bad idea since making a coil in a wire whose purpose is to prevent induction creates a big inductive opportunity. It’s better to have the cable go across the floor and never coil it up.

I also discovered that Apple makes an adapter to bring Ethernet into a MacBook Air through the Thunderbolt connector rather than through USB. I ordered one. When it arrived, I plugged it in and my MacBook jumped to a phenomenal 824 Mbs. This is 12 X the speed I got with the USB adapter. (Apple’s specification on the USB adapter says it goes to 100 BaseT which is only 100 Mbs, which explains the speed problem.)

Now all of our computers are running at full speed. Our TVs are happier, my solar panels are exactly the same, and my iPad is also happier. Everything is faster, and I am now a part of the digital community, no longer limping along with old technology

*The geeks reading this will quickly counter: No it’s not! It’s only eight bits per byte, etc. They are correct, but with what are called parity bits and checksum characters, it works out closer to ten, so I always figure that I should divide by ten. It works just as well, and it’s easier math.

Posted in Gadgets, New technology, Technology | Tagged , , , , , , | Leave a comment

My good friend Ray Prince has died

Raymond J. Prince

Ray was a man among men in the graphic arts industry. He worked tirelessly for decades to make our lives better through technological advances in printing and publishing.

Though I had known him casually for many years, Mr. Prince became a more important part of my life in 2014. We were at McCormick Place in Chicago at PRINT/GraphExpo (don’t remember which). He invited me to have coffee with him. I was happy to accept the offer.

During that conversation, Ray asked about Cal Poly (where I teach). He asked about my thoughts on Cal Poly becoming the site of the world’s largest library of printing and graphic arts books and magazines. At the time, the Wadewitz Library was housed at the headquarters of Printing Industries of America in Sewickly, Pennsylvania. They had to move, and the library had to go. Mr. Prince took it as his personal challenge to find a new home for that library.

I learned during our conversation that he was shopping around for the proper location for the books (50,000 volumes) to be housed and made available to the industry.

He was looking at Clemson University, Rochester Institute of Technology (his alma mater), and Cal Poly. He had tested the waters at each institution, and he wanted to get a sense from me if I felt that Cal Poly had the academic importance to become the new home to this extraordinary collection.

I remember the conversation. He challenged me: What makes Cal Poly the best place for this library? I told him that we have the best students; we have the best facilities; we have the best faculty. I told him that we have the best program of graphic communication education in the world.

I suppose that he liked my answers, because after he consulted with others from my department and my university, he chose Cal Poly to become the home of this library of books and magazines.

Mr. Prince came to Cal Poly, and together with my Department Head, Harvey Levenson, they made the announcement about the library. The trucks showed up the next year, and literal tons of books were unloaded into an unused classroom.

Steel shelves were erected in the backs of all of our classrooms, our meeting rooms and our storage rooms. A hole was cut in a concrete wall on the ground floor of our building and a large storage area was added to our warehouse – just for the books.

Professor Emeritus Gary Field took on the task of sorting, identifying and shelving the books at Cal Poly. He broke them into various categories: rare books went to the university’s Kennedy Library Special Collections Department, complete collections were housed in shelves in our classrooms. Duplicate books were shipped to other universities to fill out their collections.

Over the next five years Cal Poly absorbed and presented the Wadewitz Library, the GATF Collection, and many other books that were collected by Mr. Prince and Dr. Levenson. They wanted Cal Poly to be the absolute go-to library for researchers and scholars, and to be a valuable resource to our current students.

It has been a tremendous success.

In 2015, Mr. Prince asked me to attend a meeting in the conference room in our department office. He was in town for a major announcement.

I was there, joined by my colleagues Dr. Harvey Levenson, Dr. Ken Macro, Gary Field and our Dean, Dr. Douglas Epperson. I was puzzled by the request for me to attend the meeting.

Ray Prince gave a short speech about his career and his effort to find a new home for the library of books for our industry. He talked about the meeting that he and I had had in Chicago. He told us that he had planned to make a significant donation to Cal Poly Graphic Communication, and that he also wanted to establish two scholarships for our students:

The Gary Field Scholarship and the Brian Lawler Scholarship.

I was brought to tears (and am tearing-up now as I write this). I had no idea!

He handed two checks to Dean Epperson, and asked him to establish those scholarships.

He also announced that some of his other donation funds should be earmarked for the continued development and operation of the Shakespeare Press Museum (I am the faculty advisor). That donation made it possible for me to expand the museum’s collection and to repair some of our equipment in the years since. His contribution made it unnecessary for me to beg for money every year, an event that was, at times, exhausting.

Never again would I have to worry about how to pay for paper and ink for the museum. It was all covered – from now on.

In the years since then I have added to the scholarship that bears my name.

This year, on the announcement of my retirement (June), my fellow professors, and members of our Industry Advisory Board added a significant amount to the scholarship.

And at my (surprise) birthday party this year, my friends added several thousand dollars to the fund. The scholarship is now valued at about $35,000.

So, this year, for the first time, our faculty will be able to award one or two scholarships to students in our program. I am looking forward to that experience. It will be a reward to those who deserve our support to help them as they study graphic communication.

But, this isn’t about me or my scholarship. It’s about Mr. Raymond Prince. He is the man who made all of this possible. He is the man who saw value in Cal Poly’s program, and made these contributions to the department and to the industry because he believed in our students.

I believe in our students, and I am proud to share in the privilege of being a part of Ray Prince’s circle of friends and colleagues.

He believed in me, and I am honored to have known him.

Posted in Graphic Arts people | Tagged , , , | 2 Comments

Excellent typography in web pages

In a previous post I wrote about the differences between typewriter quotes and real quotation marks, and how to do it right.

I have received some nice feedback on that post.

One person suggested that while it’s great to use proper quotation marks in printed material, it is impossible to get those same proper marks in web pages. Au to the contrary! (as they say in French). HTML has an extensive library of proper punctuation marks as well as accented characters for central- and eastern-European languages (those based on the Roman alphabet).

I read the New York Times online (and in print on Sundays!). Its online presentation is an excellent example of typography and proper punctuation done right. Most other online publications pay attention to typography but let the apostrophes and other quotations fall victim to the horrible typewriter quotation marks. It’s disturbing.

When I prepare these posts for WordPress, I use proper quotation marks and apostrophes – even when I respond to an online comment. WordPress allows me to use the keyboard commands to get these marks, making it much easier than putting in the HTML code for those marks.

But, when constructing a web page with hard code, or even when using a program like Adobe Dreamweaver that does much of the work for you, it’s possible to insert the proper marks as you work. It’s a bit of work, but it’s logical. The handsome result is the reward for doing it right.

So, let’s say you’re building a page of HTML code, and you need a proper apostrophe. In the code you should type:

’

Which results in a left-facing apostrophe, correct for most contractions and possessive applications.

To get a single right-facing quote, perhaps for the opening of a quote-within-a-quotation phrase, you would type:

‘

This would yield the correct open-quote character needed for this purpose.

For double-quotes, the HTML codes are:

“

…for the opening, right-facing double-quotes, and:

”

…for the closing, left-facing double-quotes.

Interestingly, there are no correct prime marks in HTML, so making single or double-primes for actual inch dimensions is not included in the HTML character set. I suppose you could go back to the unattractive typewriter quotes:

"

…which works OK for inch marks (it’s not great, but it’s better than nothing).

And, what about en- and em-dashes? Can HTML handle those? Absolutely! To get an en-dash, the HTML code is:

–

And for the em-dash, it’s:

—

If you find yourself working on an online publication, you could set up some of the more common codes in keyboard shortcuts. I have used a program called QuickKeys on my Mac for years; similar programs exist for both Mac and Windows machines. By hitting some combination of keys you can get strings of characters for your work in HTML, or elsewhere.

I have prepared a chart showing all of the HTML characters and their respective codes. Please download it with the link below and send it to your favorite online newspaper, or to the Rachel Maddow Show (where the typography has improved, but they still don’t know about proper quotation marks).

Please click here to download this file.
Posted in Typography, Web | Tagged , , , | Leave a comment

Saved by the RAID

I’m in my second week of online teaching. It’s particularly difficult because my class is a hands-on course in digital photography and color management.

But this quarter it’s all hands-off. And that is making me crazy.

The announcement that I would be teaching online came at the end of last quarter, at the end of finals week. Cal Poly was not quick or decisive in making the decision about classes in Spring. They dithered a bit before making the official policy. Then we had two weeks to prepare and deliver.

This is a stack of 3.5 inch hard drives from my collection. There are several quintillion bytes of data here, some of it inaccessible due to drive failure. Why do I keep bad disk drives? Hmmm. It’s probably so that the Russians don’t get them and read the data.

Suddenly my colleagues and I were thrust into the world of Zoom, Screencast-o-matic and YouTube. We are also being forced (strongly encouraged) to switch learning management systems from one based on Moodle to a new one called Canvas. So I needed to learn a handful of new technologies in a short period of time. The first week was, mostly, successful (my students are patient). Everything that could go wrong went wrong. Then more things went wrong.

I am, of course, working from home. I have reasonably fast Internet over a wired mutiple-DSL connection. It works great when I am plugged in with an Ethernet cable. WiFi is altogether different. That, in my home is based on an antiquated system that I installed 15 years ago, and it is showing its weakness now. I tried on Thursday to teach my class from the dining room, over WiFi. I have 46 students, and just as they all got to the Zoom class, my Zoom crashed, and crashed and crashed. So I carried my MacBook Air upstairs while talking live to my students, and plugged in to the wire. Then it worked fine.

The strain on me and my systems is obvious, and my reaction to it is to do the best I can. I also know that I am not alone here. I hear from my colleagues that this is common. Everyone is straining under the load. I am doing OK, or not worse than my fellow teachers.

At the beginning of March, I ordered a new hard drive array from Other World Computing (OWC). This was a result of reaching capacity on my existing OWC RAID drive. I have a second drive that is running Time Machine, Apple’s excellent back-up software. It is the same size, and was also reaching capacity. My plan was to get a drive with twice that capacity, migrate the Time Machine files to that new drive, and then start over on one of the two smaller drives.

When I say “smaller” I mean huge hard drives, but relatively smaller than other huge hard drives. My primary drive, and my Time Machine back-up are both 16 TB. The new drive is 32 TB. In the new configuration that drive will become the Time Machine and the current one will be moved to everyday use. All of this seemed reasonable and easy.

Until the drive was delivered to my door.

Week One: I installed it, and ran the cable from my Mac Pro to… a USB-C plug on the back of the new drive. And that was my first problem. I don’t have any USB-C outlets or cables (I’m dating myself here). I called OWC, and they recommended an adapter made by Apple. That was the same day the Apple Stores closed. I ordered it online, spent $50, and it took a week to arrive.

Week Two: When that arrived, I plugged it in and connected the drive to the Mac Pro. And it didn’t work. Back on the phone with OWC Tech Support (fabulous tech support!!) I was asked what operating system I run. Answer: Sierra. Oh! That’s the problem! My operating system doesn’t acknowledge these new USB-C connections. I was told to update my OS. So I tried, and failed to upgrade. My third-party SSD, installed when my Mac Pro was new (2014?), would not support the upgrade because it lacked “a firmware partition.”

I searched for solutions, and found a few, one of which was to install the original SSD from Apple, and do the upgrade. I don’t have the original SSD, so that was not going to work. Another solution was to purchase an Apple-acceptable new SSD (Intel) and install that in the Mac Pro. An additional advantage was that I could order one of those with the Mac OS Catalina already installed. I ordered it.

This is my new 2 TB Intel SSD card. It has my Operating System and Applications stored on it. All other files are stored on external RAID drives, a total of 64 TB of storage.

Week Three: The new SSD arrived. I installed it (no small feat) and turned the machine on, and it didn’t work.

I contacted the seller (a really wonderful guy!) who walked me through a series of trouble-shooting steps and ultimately showed me how to create a bootable USB drive with the new OS on it. I tried, and failed to upgrade to the Catalina operating system. I was trying to go three operating systems forward in one step… bad idea. I made another USB boot drive with just one step forward in operating systems, and that one worked. After that I had the necessary firmware partition, and was able to initialize the new SSD, and ultimately to install the Catalina operating system on my Mac Pro. It was a two-day process all-told.

This is OWC’s SoftRAID software. It monitors your drives, and alerts you to impending failures. This software saved me from losing my primary hard drive RAID array last week.

Week Four: Even with the new operating system, I still couldn’t get the new 32 TB RAID to work. I called OWC tech support again. The patient man on the other end walked me through some troubleshooting steps to determine that the cable was defective. They shipped one to me at no cost (superb tech support!). While he was helping me, their SoftRAID software indicated that one of my four original 4 TB drives was failing. The software suggested that I replace the drive quite soon! The tech support man underscored that message. I ordered a replacement drive, with two-day shipping.

Week Five: The replacement drive arrived. The cable arrived, and I plugged it in. The new 32 TB drive worked. Hurrah! I installed the replacement 4 TB drive in my old RAID enclosure, and that began a reconstruction process that lasted about six hours. By morning the old RAID was working perfectly again, thanks to the new drive.

ALL of my drives were now working!

Last night I began copying my Time Machine files (66.8 million or so) from the 16 TB drive to the new 32 TB drive.

After 17 hours (no exaggeration) of thinking about copying the files from the old to the new, my software gave up. I got a message about how it had run out of System resources. I moved to Plan C (perhaps it’s D). This morning I erased my Time Machine back up disk altogether, then started Time Machine over again on the new 32 TB drive. This back-up process will inevitably take a few weeks,* but I don’t really care. I’m skating on thin ice at the moment, but every day that passes will make the Time Machine back-up more complete. When it’s finished my system will be whole again.

You may wonder why I decided to erase the Time Machine drive. I needed to do this to get the space for my current work, which includes recording videos for my online classes. My other 16 TB drive is completely full.

Meanwhile, I have been trying to get my normal work done. And I have been doing pretty well, all things considered.

Thank you to Other World Computing for making very nice products, for making very nice software, and for absolutely incredible tech support.

And, thank you to my readers for caring enough to read about this odyssey. There may be something in here that will be helpful to others as they try to accomplish the same tasks.

*Checking in on Wednesday, April 15: It took less than three days to make a complete Time Machine back up of my drives.

Posted in Technology | Tagged , , , , , , , | Leave a comment

From variable-frequency drives
to hand-bound books

It’s been about a month since I wrote my last blog. It was about variable-frequency-drive high voltage motor controllers and a 1935 book sewing machine. The relevance of that is cloudy, but suffice it to say that I have been deeply involved in bookbinding for the past two months.

The motor controller works perfectly, thank you. The machine also works now, but it still needs some work. I made a new drive belt and added that to the machine, and it works nicely. The problem now is the clutch, which needs to be disassembled, cleaned and reassembled. I am eager to do that, but I cannot, because I am now in isolation at home. I am not allowed on campus, so my machine is standing idle, waiting for some more effort to get it into perfect working order.

In the month since I wrote last I have been teaching a delightful class called Book Design Technology. It’s a course that is required of some of our students. It’s senior-level, and most of the students are graduating this week or in June. I had 34 students in the class.

We start the quarter as advanced typographers practicing what I call long-form typography. The students are required to find a book manuscript, edit the manuscript, and prepare a book from that manuscript. This involves cleansing the manuscript, editing, composing it into pages in Adobe InDesign, and preparing it for print. It is in this part that the students learn about GREP searches, and learn about the importance of tagging everything in the book manuscript with Paragraph and Character Styles.

Once the book is readied for print, we learn how to fold, collate, sew and bind books by hand. We start with a blank book to prepare the students for their much larger and more complex finished books. On several mornings this quarter I was in our book bindery with 16 young people, each armed with needle-and-thread, glue, brushes and book cloth. We stitched our signatures together using a traditional butterfly stitch (a hook-stitch).

The students begin by poking holes in 16-page signatures using an awl, then sewing with bookbinder’s thread in and out of the centers of those signatures. Each successive signature is sewn to the previous signature using the butterfly, where the thread exits the signature, is passed under the same stitch in the previous signature, then back into the signature to pass to the next set of holes.

This shows the sewing technique. The first signature (bottom) was sewn first, followed by the second, which is sewn individually, and simultaneously hook-stitched to the previous signature. The process continues until all the signatures are sewn into a book block.

It’s a relaxing and fun activity, and it requires manual dexterity, attention to detail and confidence. This was the first book-sewing experience for these students. They all did well.

Once the signatures are sewn, the spine is glued, the book block (the collected signatures) is trimmed square on three sides, and a cover is made. We used common buckram fabrics for the first books, but the students graduated to more refined materials for their final books. Some chose satins, others made their own cover materials (one young woman laser-cut her cover boards on thin sheets of wood). One adventurous student used velvet, a material that I have never seen as a bookbinding cloth before.

The covers, when complete, are laid out on the work tables, and the sewn book blocks are glued-in, using linen fabric for the spine, and decorative end-papers for the bookends. The results were spectacular. I have taught this class numerous times in my career at Cal Poly, and the work is always extraordinary.

I was working in parallel while my students were making their books. I chose a manuscript written by the late father of a dear friend. That manuscript, accompanied by about 100 family photos, I turned into a handsome hand-bound volume. I was working side-by-side with my students so that I could answer their questions about the process with fresh experience. I had not bound a book since last summer, so I needed to brush-up on my skills.

This is the book I created in my class. I was working in parallel to the students all quarter long. Then, at the end of the quarter I added the slip-case.

When I was finished with the book manuscript for my book, I decided to foil-stamp the cover, and to build a slip-case for the book. Slip-cases are not part of the assignment for my students, but then can make one if they wish. I had not done this before.

I took it on like a packaging project. I drew a detailed die-line for the slip-case, including scoring and cutting lines. I drew a detailed cutting diagram for the wrapper. Then I built mine and it was a disaster. I had chosen board too thin for the task, and I failed to line my box. On the second try I did better. I lined the boards, built the box, wrapped the box with book cloth, and the book didn’t fit inside! The addition of lining paper had made the fit so tight that I could not get the book inside.

I threw out both drafts and redesigned my case. This time I approached it differently. I made separate side boards, abandoned scoring and folding, and simply glued-up a box to fit the book (plus extra for the cloth and lining). I used the same board I use for book cases, so it was much thicker and thus much stronger.

This is my completed slip-case. It is lined with fine paper, and covered with traditional bookbinding cloth called Buckram.

The third time I succeeded. My slip-case is a nice addition to the project.

The experience came in handy when on the last lab day I accidentally ruined one of my student’s books while foil-stamping the cover.

She was crushed. I was crushed. The cover was melted (she had used a book cloth whose washable surface was made of plastic). I offered to make a new slip-case to replace the one I ruined.

The recent experience making my third, successful, slip-case proved valuable. I made the replacement slip-case for her, and it went together easily and quickly.

As a result of this I made a complete instruction manual for slip-case making.

Click here to download a copy of my slip-case instruction document.

In any event, the book design class was a tremendous success, marred only by the end-of-the-quarter arrival of the COVID-19 virus. I was forced to cancel the final exam, which was to be a book show, and I never got to see most of the finished books. Instead, I had the students photograph their books and submit the photos. From those photos I have made a slide show that I will share with them as a final exam.

The books are amazing!

Posted in Art, Bookbinding, New technology, Printing and Printing Processes, Typography | Tagged , , , , | Leave a comment

Electronic motor control
and my obsession with a 1935 bookbinding machine

This is the second part of my obsession story. To read the first part, please click here.

And that’s where my odyssey began. Alternating current induction motors use the frequency of the line power (60 Hz in our case) to set the speed of the motor. To change speed, one must vary the frequency. For that there is a relatively new technology on the market call the Variable-Frequency Drive. These devices, all solid-state, are miraculous for this purpose. VFDs can be obtained that convert single-phase electricity to three-phase (solving one of the great machine shop problems of the world), and converting three-phase 60 Hz to three-phase almost-any Hertz for motor control.

I researched these and bought one made by a Chinese company called Teco, a company affiliated with Westinghouse. They are solidly built electronic devices that will take one kind of power in one side and then push a different kind of power out the other end.

This is the Teco/Westinghouse Variable-Frequency Drive. It is a solid-state power device that can take 208 VAC three-phase at 60 Hz, and convert it to the same voltage out, but with variable frequency. Connecting it is relatively simple; programming it is a bit harder.

But it’s not that simple! In order to run a VFD, I would need an electromagnetic contactor, a circuit breaker, three fuses, a 24 volt DC power supply (to operate the contactor), and a cooling fan to keep it all from overheating. All of this went into a large steel utility box. And, into that box I had to drill and saw about 50 holes. I also designed and built a handsome remote control box. That box is now mounted close to the operator’s seat while the rest of this equipment is 18 inches away, on the top of the machine.

A warning: high voltage electricity can kill you! It’s potentially dangerous, and adventures like this should only be undertaken by those with skills and knowledge of electricity and electrical wiring. Always disconnect from the source power, or turn off the main circuit breaker when working with electric components, and never assume that the power is off. Check to be sure, using a meter to test for live current. Believe me. If in doubt, don’t do this! Hire a licensed electrical contractor.

Since this is a State of California installation, and strict safety rules apply to all such things, the whole system was built to-code (which would be smart in any case). All the wires had to be of the correct gauge and color, and all of the connectors had to be properly prepared. The external wiring was run in oil-tight conduit.

In the process of building this device, I learned about DIN 35 standards and DIN 35 rails. DIN is the Deutsches Institut für Normung (German Institute for Standardization).  These are systems devised for industrial electrical equipment, and they are impressive. If you need a flux capacitor, you can find one on eBay with the standard DIN 35 rail to mount it to your assembly. I bought several sections of DIN 35 rail, and put one strip in the back of my box. All of the other components simply clip onto to the rail, making assembly and wiring very easy. The whole thing has a clean, professional look as a result.

This is my draft schematic diagram. It shows how the wires connect to make the motor run. Included are the safety devices: the circuit breaker and three fast-blow fuses, which are recommended by the manufacturer.

On projects like this I like to start with a schematic diagram to get the wiring figured out, then I advance to a scale drawing, with wiring, to-size. I do these drawings in Adobe Illustrator, and I am compulsive about them. The components must be accurately drawn, and the wires must be run correctly in the drawings. This allows me to see if things won’t fit, or if I am making a colossal error in putting the breaker to the right of the power supply. In one instance, I realized the the electromagnetic contactor should be mounted upside down. This allowed me to wire it more logically, and for the wires to move left-to-right, and never over or under the electrical components.

This is the final wiring diagram, which I drew to-scale. In this way I can see if I have left enough room for the wires and the components. Notice that the electromagnetic contactor is mounted upside-down. This gave me the chance to install the wires to the fuse holders more efficiently. The National Electrical Code requires only that the circuit breaker be mounted right-side-up, so that up is on and down is off. This diagram also includes the low-voltage power supply and the low-voltage control wiring going to, and coming from the remote control box.

In this way I build my electrical projects more effectively by carefully following the drawing. If every wire is in the drawing, and I follow the drawing carefully, there is little chance of an error. With 208 volt power, errors have consequences I cannot afford.

Two steps in the construction of this electrical system were out of my normal routine. I seldom work on steel in my shop; usually I work on aluminum and wood. This one required a steel utility box with lots of holes. I drilled some, I cut one with a saber-saw, and I used chassis punches to cut three others. The chassis punches are the cleanest and easiest, as they cut a sharp edge with precision, and there are no metal chips that get loose.

This is the box with the finished electrical components in it. The power comes in on the lower-left, then travels up the left wall and over to the circuit breaker, then on from there to the 24 VDC power supply, the electromagnetic contactor, and the fuses. On the right is the Variable-Frequency Drive. Power ultimately exits on the lower-right to go to the motor. The coiled white wire is the remote control low-voltage line. It leaves the box and travels about 18 inches to the remote control unit on the front of the machine, then back to the VFD.
The wire that comes out the front of the box is the wiring to the emergency-stop button on the box cover. I made a programming shunt to put on that cable when the front cover is removed for servicing.

To get all the holes in correct position, I made templates, cut on my CNC router, in an aluminum material called Alupanel. This stuff is a laminate of polyethylene with two outer layers of aluminum. It cuts easily on the router. Once those were made, I clamped them to the electric box’s sides, and then drilled or punched the holes through the holes in the template to match. On the top of the box are a pattern of 1/2 inch holes to vent heat. I drilled those on my drill press (not much fun).

Once the holes were drilled, I cut the burrs off, sanded the outer surfaces, and painted the box with a medium gray spray paint. This covered all exposed steel edges and made the box look more professional.

From there it was simply a matter of mounting all the hardware, and wiring the devices together. That took me about a day in the shop. I was careful to crimp, then solder, then shrink-tube most of the connectors. Adding lugs to the ends of wires proved unworkable in some cases; others worked fine. In the end, my finished motor control box looks a lot like the Adobe Illustrator drawing. Every wire is in its place; every tie-down is in proper position to keep the wires from getting confused.

This is the new motor and electric box, with controller inside. The new motor is a totally enclosed, fan-cooled motor. The motor controller box has a cooling fan which draws air in from the bottom, expelling it from the top. I am confident that the new power will drive the machine effectively. On the face of the box is the emergency stop button, which cuts power to the entire system by removing power to the electromagnetic contactor coil.

At the museum, I attached the control box to the top of the machine, I then installed the conduits for the motor and the power cord, and I wired the remote control box, and mounted it to the front of the machine on a steel bar that was already there. For this I drilled and tapped two holes for machine screws to hold the box in place. The control wiring is all low voltage, either 10 or 24 VDC, neither of which require conduit, so I ran the shielded control wire out of water-tight grommets on the back of the control panel, and into the control box. It looks great; it works great.

Meanwhile, in bed at night, I read the instructions for programming the Variable-Frequency Drive. Since it’s a solid-state device, and it has a programmable logic circuit within, there are many adjustments you can make in software. One can control minimum and maximum frequencies (translate to motor speed), speed ratios, and you can turn on the remote control wiring if you have it. That moves the power switch and motor speed controls to my external box. Inside that box are a simple power switch and a potentiometer. The potentiometer varies a 10 VDC signal from the VFD, causing it to speed up or slow down in proportion to the resistance of the potentiometer.

I couldn’t test these settings in my shop because I didn’t have 208 three-phase power to work with, and the motor was already mounted on the machine in the museum, so I postponed programming the VFD until the device was wired and ready to run on the Smyth machine. Once I moved the box to the museum and installed it atop the machine, I was able to apply power to the VFD and test it (the motor turned!). I was successful with the wiring of the control box and motor.

The fast-blow fuses and fuse boxes were purchased on eBay, and shipped from China at the same time as the Corona Virus outbreak. I was told by e-mail that these parts would be delayed. So I built the rest of the system without these optional but important parts. For testing, I still had the circuit breaker in the box. I left space for the fuse boxes once they arrived, and wired them in once they arrived. The DIN 35 parts are like building blocks; I mounted the wires, installed the fuses, then clipped the boxes onto the rail.

This is the front view of the machine. At the top are eight spools of thread; in the center, those threads go through a series of needles that sew the spines of book signatures together. The process involves three different parts: punches, which poke holes from below, needles, which push thread from above, and crochet hooks, which pull the threads sideways, allowing them to be pulled back up through the signature. Each needle/punch and hook combination makes a chain stitch along the edge of a signature, and each signature is sewn to the previous signature. Together, they form a beautifully-sewn book block, ready to be glued and encased in a book case (the cover).

Mechanical problems were my next challenge. The original motor was about 50 percent larger than the new motor, and the mounting holes were further apart. At the beginning of the project I took the large cast iron frame to my shop and drilled and tapped four new mounting holes for the replacement motor. That left the new motor about one inch lower than the original. After installing the electric box and all of its connections, I put the drive belt back on, and it was too loose by about one inch (surprise!). The motor mount can be moved, but not enough to make up for the slack created by moving the motor down as I did. I had several possible solutions: 1 – move the motor up (couldn’t do this because the old holes were in the way), 2 – modify the mount plate (couldn’t do this because of the details in the iron casting), or 3 – get a shorter drive belt. This proved to be the best option because they are relatively easy to get, and the 1935 drive belt is well-worn. I ordered a two-inch (circumference) smaller drive belt from McMaster-Carr, the industrial hardware company in Los Angeles.

Another mechanical problem was that the new motor has a larger drive shaft than the old one did. I took the 5.5 inch phenolic pulley off the old motor and took it to a local machine shop to have it machined to the larger diameter, and keyed for the new shaft. This took a few days, but was expertly done. I installed the modified pulley on the new motor and it fits with precision.

Now all that is left is to install that belt and test the machine. I’m sure I’m not finished yet, as I have not cycled the machine under power yet. Once the new motor and all of its fittings are in place I will do that. I hope that there are no more problems, but I will not be surprised if there are. It is, after all, a machine that once worked in production, was then put out to pasture for several decades, then revived.

What will I do with the machine when it’s complete? I will sew books, of course! More on that in a future blog.

Posted in Bookbinding, Education, Imposition and Pagination, New technology, Printing and Printing Processes, Technology | Tagged , , , , , , | Leave a comment