

The Graph tool in Adobe Illustrator has been around a long time, and has not been improved much since it was first released.
It’s a strange tool because it is capable of generating some lovely visual information, but it’s frustrating because it limits your ability to make changes to the graph without losing its identity as a graph. That’s not always bad.
Graphs are theoretically editable after creation, meaning that you can change or correct the data, and the graph will automatically update. But it wraps components of the graphs so tightly in Groupings and graph contents that you often can’t make even simple changes without violating the sanctity of the data.
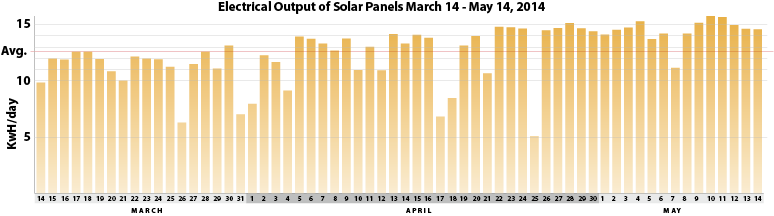
This is the actual output, in kWh, of my solar power system since it was activated on March 14. I drew the graph using Illustrator’s Graphing tool, and then did a bit of retouching and embellishment.
I have used the Graphing tool many times, but not recently. I decided to put it through its paces a couple of days ago when I was evaluating the output of my now two-month-long experience with rooftop solar power generation. My power inverters are made by a company called Enphase, and a part of the system is a very impressive data collection function that collects output information from each individual panel, and forwards that information over the Internet to your online account where you can go to check the status and power output of your system.
Using a web browser, you can check in with your system and get up-to-the-minute output wattage, monthly, and lifetime totals. You can also create reports and download a Microsoft Excel file that itemizes your power production by interval. I chose to get that report for the entire time my system has been operational. This is a pretty manageable amount of data, as I have only been running the system for 60 days.
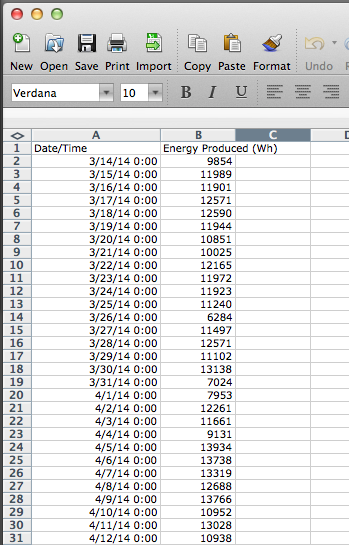
This is Excel’s view of my solar power output. The data come in formatted with too much text in the date/time entries, so I need to remove them. This never works well in Excel, so I copy the columns and paste the data into a word processor to make those changes. Once that’s done, I move to Illustrator and create a new bar graph.
Once in Excel, I copied and pasted the two columns of information into my favorite text editor, Tex-Edit Plus, a shareware word processor with GREP capabilities (I love it!). I didn’t use any GREP for this project, but simply used that program’s Find and Replace functions to remove text I didn’t want for my graphs. The month and year were unnecessary, so I got rid of those. Then I copied the remaining data into the clipboard and went to a fresh Illustrator page.
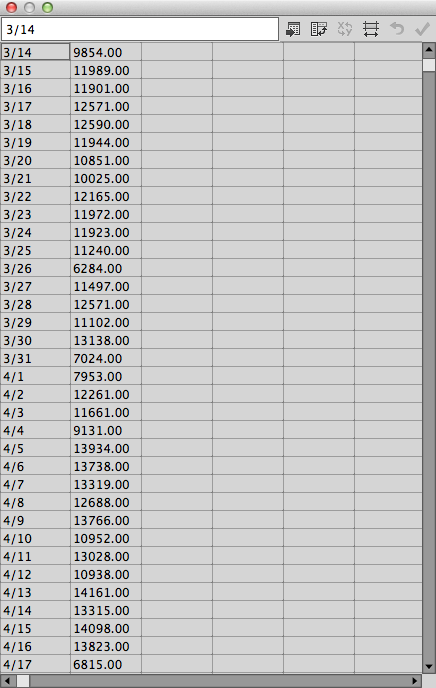
This is the spreadsheet view of Illustrator’s Graph tool. Here, the data are prepared for graphing. It has a nice function where you can switch the X and Y axes of the chart if you paste data in that are in the wrong order.
In Illustrator, I created a new graph by choosing from the Graphing tool pull-out. The two most likely to be successful are the line graph and the bar graph, so I chose the bar graph. Following the advice of Edward Tufte, the genius of information presentation, I always try to make my graphs reflect an honest picture of the situation I am trying to explain. It’s really easy for graphs to go badly, and it’s wise to remember scale, proportionality, and visual honesty when making any graph. I dragged a long horizontal rectangle onto the page, which causes a spreadsheet entry table to appear. I simply pasted my two columns of data into that spreadsheet, and clicked OK.
I am always shocked when I first see any graph created by Illustrator because they are just a mash of text and graph elements piled atop one another. This was no exception.
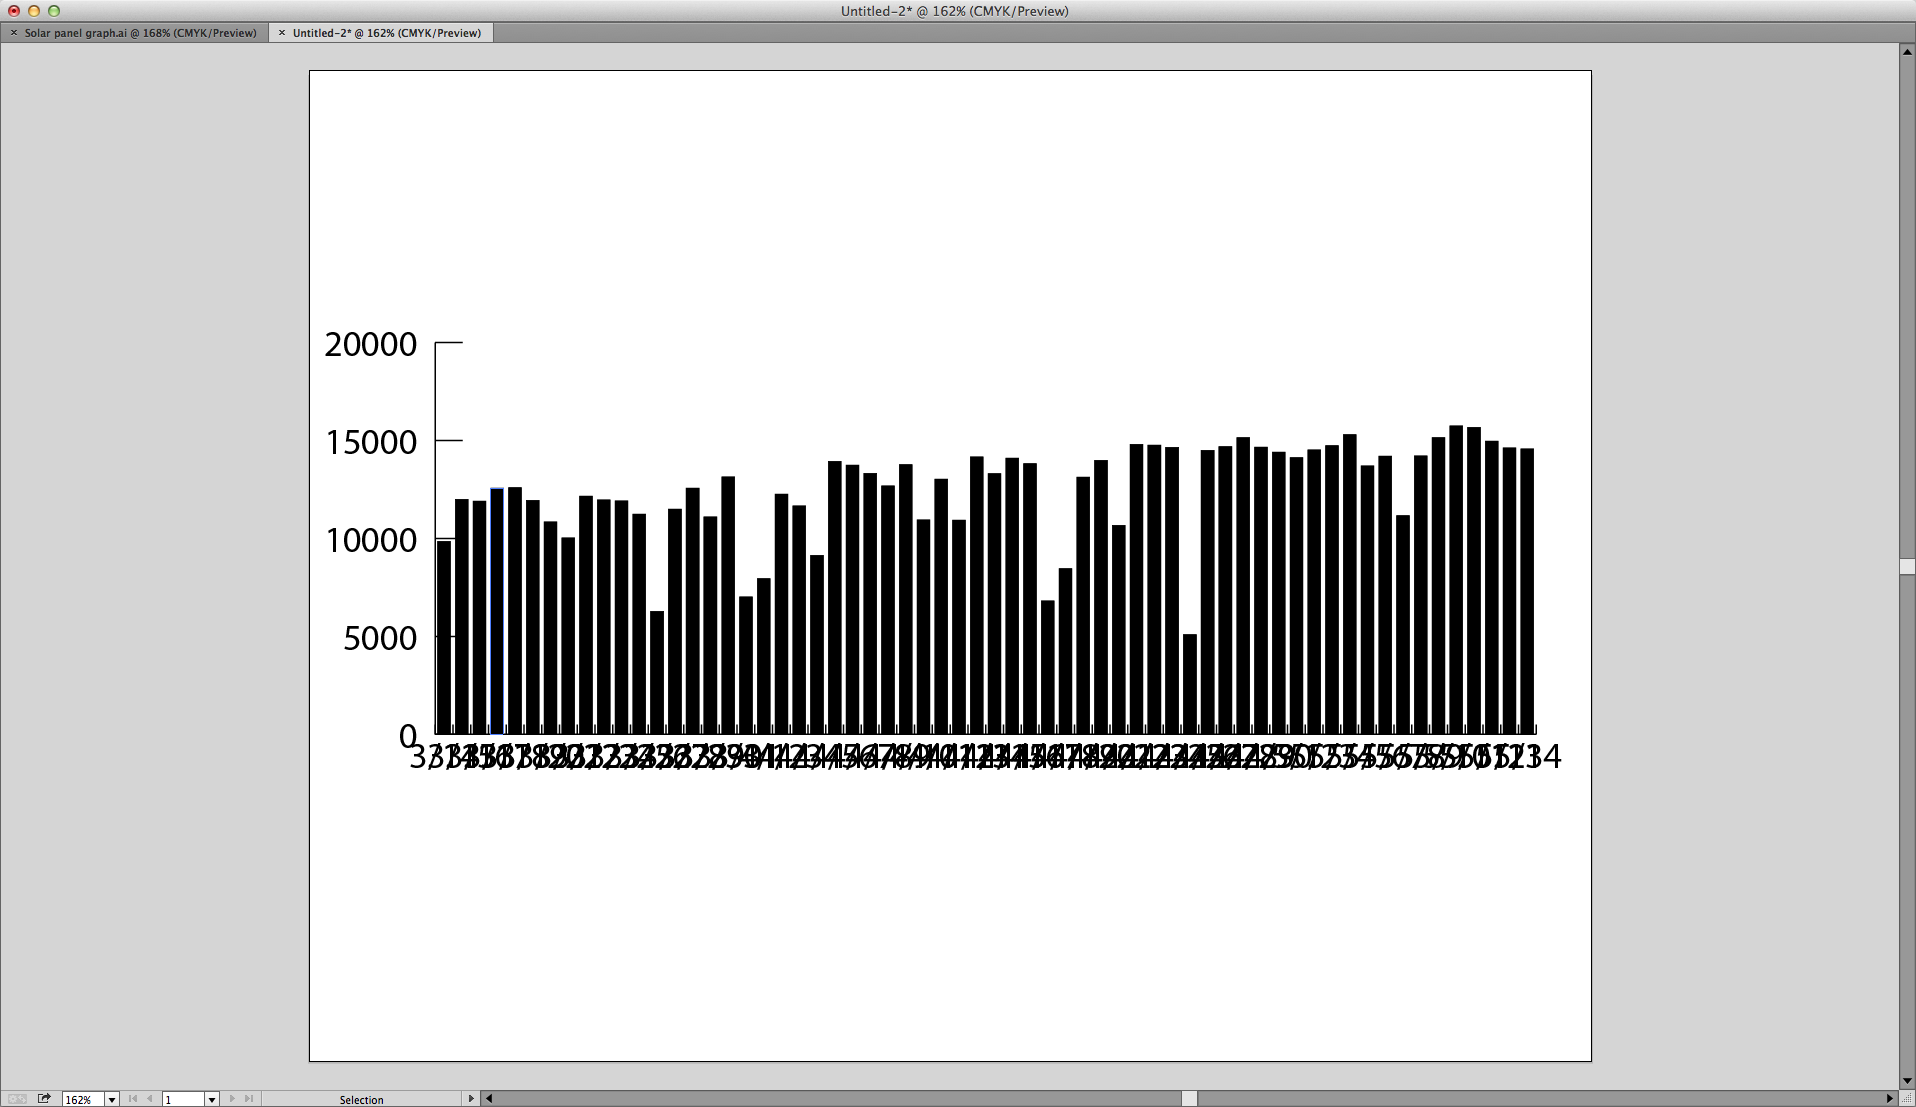
This is what I saw first, a mash-up of data and text. It looks unmanageable, but you start with the point size of the type, and suddenly the graph is legible.
The first thing I did was to reduce the size of the type from whatever it was when it landed to about 8 pt. This made it readable. Then I began the slow process of cleaning up the graph. Using the Direct Select tool (open arrow), I chose the type for the dates at the bottom, and reduced its size again, then centered each block of type by choosing center align with the keyboard command Shift-Command-C. Then I moved that lettering closer to the graph base, and made it bold. These are things that Illustrator will allow to a graph without ungrouping it or Expanding the graph.
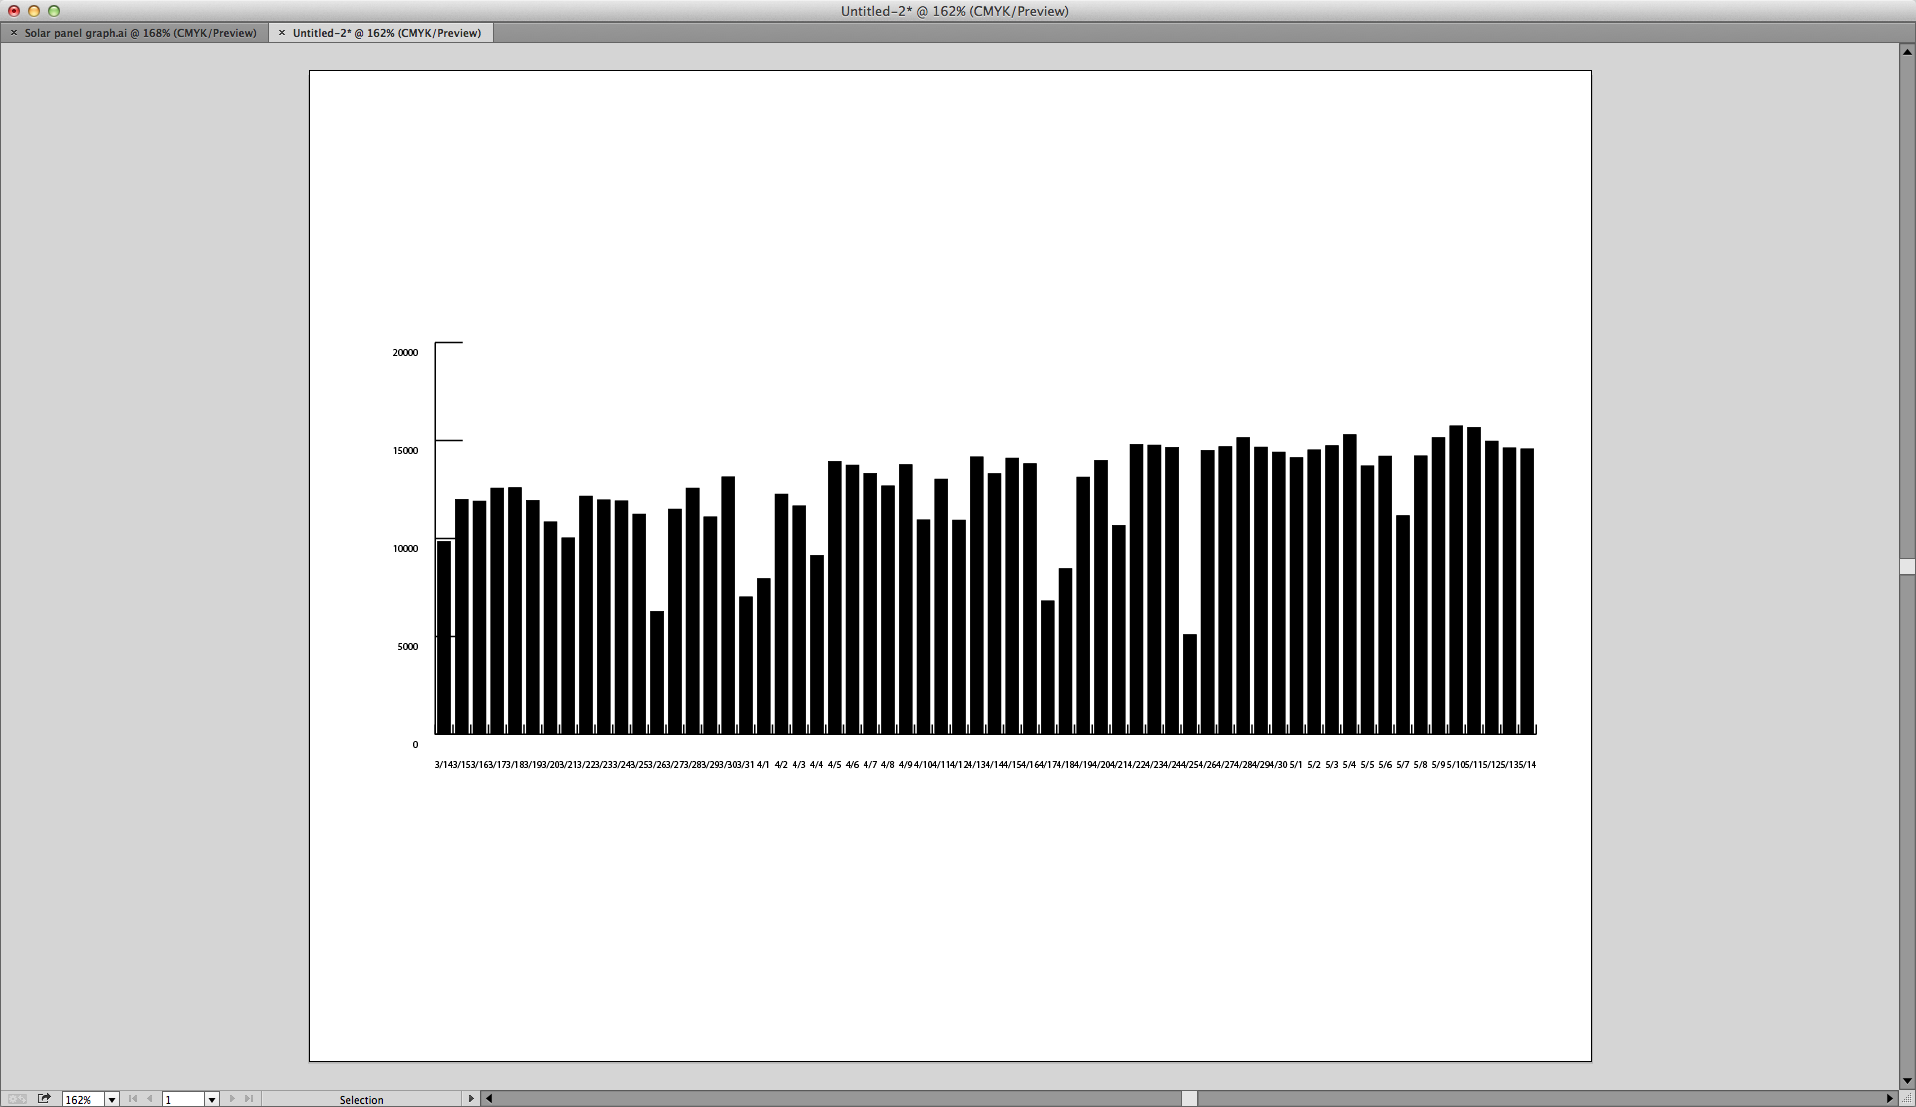
Here I have changed the point size of the type to 8 pt. It is now intelligible.
Selecting all the vertical bars is easy. I used the Select menu, with Same Stroke as the option, and they were all selected. I changed the fill to a gradient, removed the stroke, and then adjusted the gradient with the Gradient tool so that the warmer yellow-orange was at the top while the yellow end was at the bottom.
From there is was just a matter of embellishment. I added a title, added a legend on the left edge, and then added horizontal lines in the important range of data – those bars with values between 10 and 15 KwH. These lines indicate one-kW values. I finished it off with a new line indicating the Average of the data (12.55 kWh).
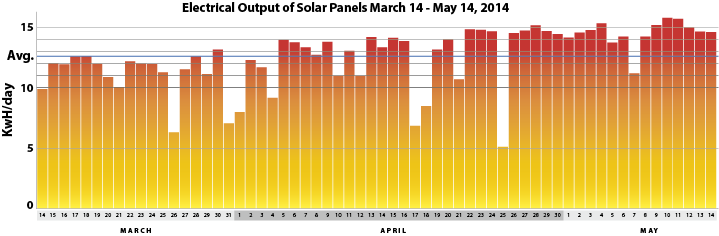
This is my bold color version of the chart. Here I have changed the gradient to a stronger pair of colors, and I have reduced the white spaces between the bars. I have also added Month labels at the bottom, and a line indicating the Average output of the system each day (12.55 kWh).
I also made a more dramatic version of the graph with a stronger set of colors in the gradient, and, separately, a line graph of the same data, all with adjustments to the appearance of the graph as created by Illustrator. When working with the bars in the second graph, I wanted to make them wider, without making them taller. To do this, I selected them all, and had to Ungroup four times before I could effect a Transform Each function on them. With that, I was able to widen them without making them taller.
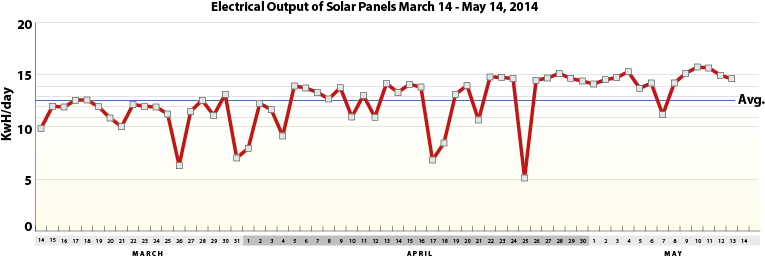
…and this is the line graph of the same data. It shares the months and days from the bottom of the other graphs, but has the line motif, which is powerful, but I don’t think as effective as the bar graphs.
Of the two styles of graphs, I think the bar graph is more relevant because it shows that production is continuing every day, and that it’s not just the top value that I want to display. I guess that to depict this with complete honesty, I would have to show the hours when the system is not producing any electricity. I’ll attempt that on another day, with bars that show not only the peak generation of electricity, but the off-hours. That would work better for an hourly graph, I am sure.
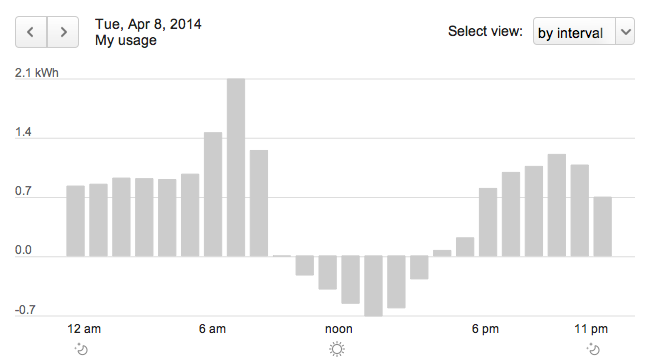
This is my electric utility’s graph of my hourly electrical consumption for April 8, 2014. Notice that in the middle of the day we generate more power than we need, meaning that we are feeding electricity to the electric grid during those times.
Another variation would be to show electric consumption overlying electric generation, which would show that during the day we make more electricity than we need, and in the evenings, we don’t make any at all, but continue to consume electricity from the power company. That would be a bar graph with lines going both up and down, with perhaps a line showing peak solar generation going across the tops of those bars.
Hello, Brian…
I need to create a line graph with labeled markers. I already create the marker design, with label. But I need to customize the way this value is shown. When, in the sheet, I type, for example, 55.472, the marker label print 55472. I want to print 55.472.
In other case, I need to print, for example, 6,10. But, in Illustrator CS6 (in english) the label print 6,1. In Illustrator CS5 (in portuguese), it prints 6.10. But I need exactly 6,10 (with comma and not rounded up or down).
Could you help me? Thanks!
Hi Luis,
I have not tried to do what you are doing. It may be easiest to make the graph, then “expand” the graph, and change the periods (U.S.) to commas (EU) using Find/Change.
For the rounding, there may be a setting in the Graphs tools to handle that. I will check.
Brian
Thank you so much! Even I expand the graph, the find/change tool don’t find the periods… I’m considering make those marker’s labels directly in InDesign… unfortunately.
Hi Brian
we are trying to link an Excel spread sheet into a graph created in Illustrator and then to enable our clients to update Excel so that the graph in Illustrator is updated automatically. I am being told that this is not possible. Would you be able to assist?
Thanks
Alban
Hi Alban,
I’m sorry it took so long to respond. I have been taking a blogging break. But now I am back! I don’t think it can be done with AppleScript, but Javascript can control Excel (as can Visual BASIC). With Javascript, it would be possible to control both Excel and Illustrator. To learn how, you can download the Adobe Scripting Manual for Illustrator, and then find a reference for MS Excel. That should make it possible, though you may encounter a steep learning curve.
Best wishes,
Brian P. Lawler
Graphs Made Easy is inexpensive and makes great looking graphs with simplified data entry, or by importing data from Excel style programs. It has some solutions that may be unique, like multi-coloured line graph lines. Website: http://www.graphsmadeeasy.com (Disclosure: I work for GME)